Call us: +1 786 2060034
info@consensusintl.com
Consensus IntlConsensus IntlConsensus IntlConsensus Intl
  • Solutions
    • What is SAP Business One
    • SAP Business One Cloud
    • SAP Business One HANA
    • SAP Business One Mobile Apps
    • SAP Business One Web Client
    • SAP Customer Checkout POS
  • SAP Business One for Your Industry
    • SAP Business One for Distribution
    • SAP Business One for Food and Beverage
    • SAP Business One for International Trade
    • SAP Business One for Manufacturing
    • SAP Business One for Pharma
    • SAP Business One for Professional Services
    • SAP Business One for Retail
  • SAP ERP Services
    • From MACOLA to SAP Business One, ERP for small to midsized businesses
    • SAP Business One Implementation Methodology
  • Resources
    • Consensus Blog
    • SAP Business One E-Learning for beginners
    • SAP Business One Success Stories
    • SAP Business One Tips and Tricks
    • SAP Business One Webinars and Workshops
    • How to Guides / Demos
    • Videos and Tutorials
    • Resources
  • Consensus
    • Our Values
    • Partnerships
  • Contact Us

BP Master Data Graphs

    Home Sin categoría BP Master Data Graphs

    BP Master Data Graphs

    By WebMasterUSA | Sin categoría, USA | Comments are Closed | 12 September, 2022 | 0

    BP Master Data Graphs

    Have you ever felt that data would be easier to understand in graphs? So have We and that is why we are bringing you this cool tip! Did you know that SAP Business One offers Graphs to visualize Business Partners’ Balances such as Acoount Balances and Purchase Orders? Here we’ll show you how.

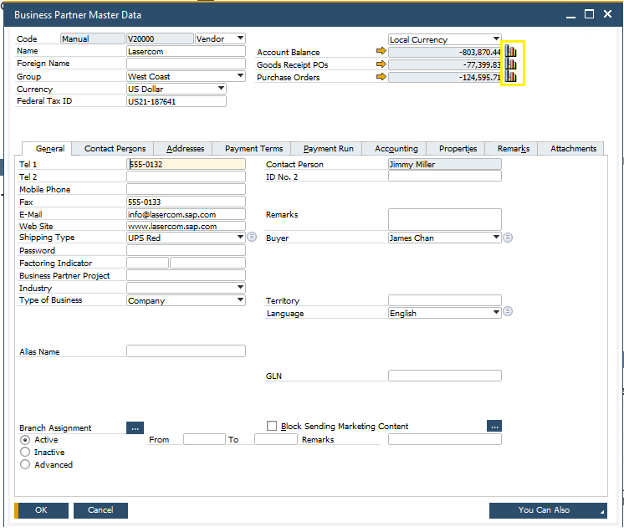
    First, we open the Business Partner Master Data file of the Business Partner we want to visualize and then we click on the Graph Icon we see on the right of the balance we want to visualize.

    BP Master Data Graphs

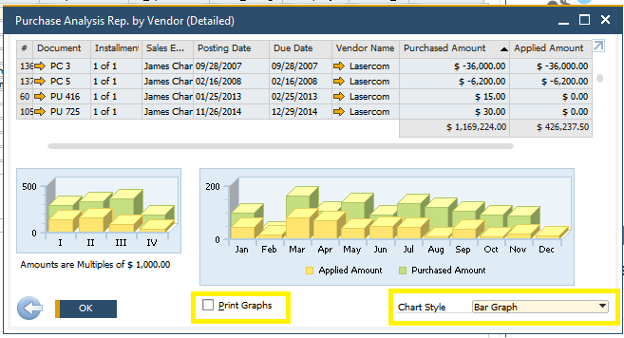
    After clicking a Window will open populated with information such as Purchased Amount by document and the Sales Employee responsible for the sale. Below that infor you will find a nice and tidy graph representing the info divided by month. In the window you will find options such as Print Graphs or A Dropdown with different Chart Styles to choose from

    BP Master Data Graphs-2
    No tags.

    Consensus Intl is a company established by a group of experienced consultants who were passionate about solving their clients’ problems. After many years of continuous growth, Consensus has helped more than +900 companies around the world to simplify, streamline and automate their organizations. By implementing advanced technology and strong business practices, Consensus Intl has enabled clients to run their businesses more efficiently, innovate and adapt to market conditions, increase revenue and increase profits.

    Subscribe To Consensus Newsletter

    SAP-gold-partner-consensus
    CONSENSUS INTL - Copyright 2020 | © All Rights Reserved
    • Solutions
      • What is SAP Business One
      • SAP Business One Cloud
      • SAP Business One HANA
      • SAP Business One Mobile Apps
      • SAP Business One Web Client
      • SAP Customer Checkout POS
    • SAP Business One for Your Industry
      • SAP Business One for Distribution
      • SAP Business One for Food and Beverage
      • SAP Business One for International Trade
      • SAP Business One for Manufacturing
      • SAP Business One for Pharma
      • SAP Business One for Professional Services
      • SAP Business One for Retail
    • SAP ERP Services
      • From MACOLA to SAP Business One, ERP for small to midsized businesses
      • SAP Business One Implementation Methodology
    • Resources
      • Consensus Blog
      • SAP Business One E-Learning for beginners
      • SAP Business One Success Stories
      • SAP Business One Tips and Tricks
      • SAP Business One Webinars and Workshops
      • How to Guides / Demos
      • Videos and Tutorials
      • Resources
    • Consensus
      • Our Values
      • Partnerships
    • Contact Us
    Consensus Intl